The line chart or timeline graph is perfect for usage in reports and documents since it allows us to visually comprehend and monitor changes over time.
Numerous companies still rely on Microsoft Excel, a straightforward yet powerful tool, for data storage and tracking, as well as for creating insightful charts. However, this tool can be a little challenging to use when making complex charts or modifying line charts.
This article will guide you through the entire process of creating a line chart in Excel.
What is a Line Chart?
A line chart has always been one of the most effective methods for presenting data as a series of data points.
Excel’s line charts are a data visualization tool that shows information as a series of data points joined by straight lines. These charts help display and examine patterns or trends in data across time or between various categories. Users can more easily spot patterns, peaks, and troughs in the data set by using line charts to see the progress or fluctuation of one or more variables.
A marker on the line represents each data point, usually displayed against two axes:
- The vertical (y-axis) represents the dependent variable
- The horizontal (x-axis) represents the independent variable.
The graph’s line’s rises and falls highlight patterns in your data; a downward slope denotes a decline in values, while an upward slope suggests an increase.

Types of Line Charts in Excel
Line Chart

It is a simple chart with a line connecting the data points.
Stacked Line

The purpose of it is to demonstrate how parts of a whole change across time. The lines in this graph are cumulative, implying that each subsequent data series is added to the first, so the top is the sum of all the lines below it. The lines never cross as a result.
100% Stacked Line

It is similar to a stacked line chart, except that the y-axis displays percentages. Since the top line indicates 100% of the total, it’s perfect for illustrating part-to-whole contributions over time.
Line with Markers

It enhances the visibility of each data point by adding visual markers.
Stacked Line with Marker

It uses stacked lines and markers for each data point.
100% Stacked Lines with Markers

It demonstrates 100% stacked lines with markers.
3-D Line Chart

It is a three-dimensional version of the standard line chart for more visual impact.
How to Make a Line Chart in Excel
Follow the following steps to make a line chart in Excel.
Step 1. Prepare Your data
Since a line graph needs two axes, your table should have at least two columns: one for the dependent values in the right column(s) and one for the time intervals in the leftmost column.
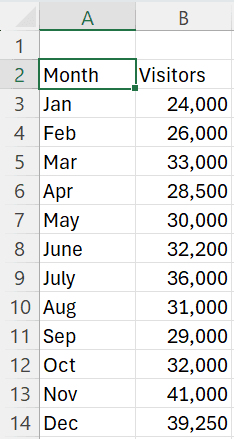
Since we will be creating a single line graph in this example, the sample data set contains the following two columns:
Step 2. Select the Data
In most cases, Excel can automatically select the entire table if you only select one cell. If you want to plot a portion of your data, choose that portion and make sure to include the column headers.
Step 3. Insert Line Chart
- After selecting the source data, go to the “Insert” tab and select. Click “Insert Line or Area Chart” and select your preferred template.
- Upon moving your mouse over a chart template, Excel displays a description and preview of the chart. Click the template of your preferred chart type to insert it into your worksheet.
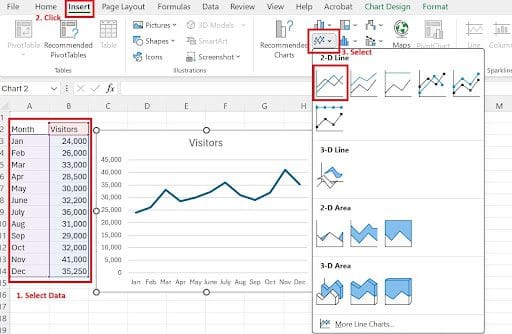
Your Excel line graph is now complete, so you can stop here unless you want to make some adjustments to make it look more appealing.
How to Make Line Chart with Multiple Lines in Excel
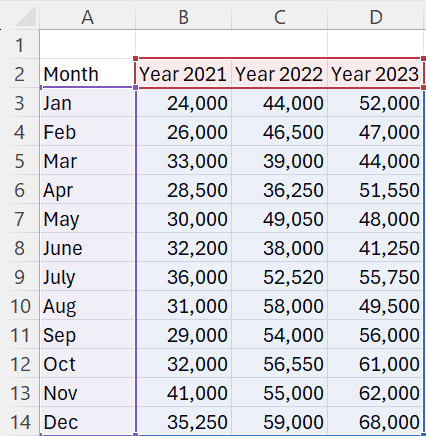
To create a multiple-line graph, use the same instructions as for a single-line graph. Nonetheless, your table needs to have a minimum of three data columns: observations (numerical values) in the right columns and time intervals in the left. Excel will plot each data series individually.
After selecting the data, click the “Insert” tab followed by the “Insert Line or Area Chart” icon, and then select 2-D Line or another graph style of your choice.

How to Customize a Line Chart in Excel
Although Excel’s default line chart already has an effective appearance, one can still customize it to improve it. To make your graph look distinctive and sophisticated, it’s a good idea to start with the standard customizations.
Adding Chart Title
- If the chart does not have a title, click the “+” button next to it and select the “Chart Title” option.

- Click on the chart title area and add a chart title or edit an already existing one.

Customize Axis Lines and Axis Options
Customize your line chart’s settings and axis lines. This can highlight crucial data points and make it easier to read.
Format Axis Lines
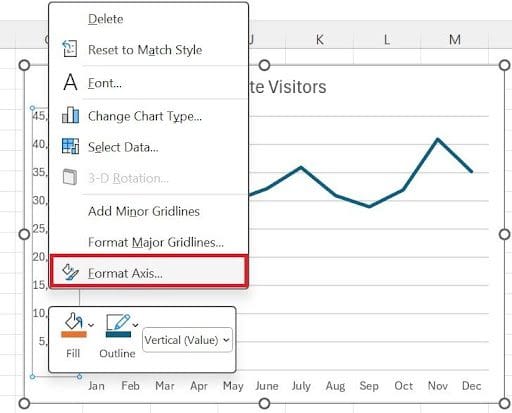
Right click on the axis and select “Format Axis”. Change the color and style of the lines in the Format Axis pane.
Adjust Axis Options
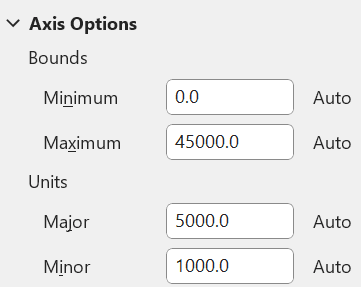
- Set Axis Bounds: Excel automatically sets bounds. To focus on particular data ranges, change the minimum and maximum bounds.
- Set Axis Unit: Excel automatically assigns major and minor interval units. Make things more readable by customizing the label spacing.

Format Gridlines
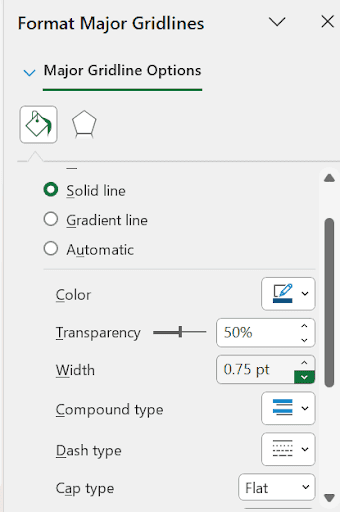
You can enhance the clarity and aesthetic appeal of your Excel line graph by personalizing the gridlines. To prevent drawing attention away from the data, use light colors and thin lines. To maintain attention on your data points, increase openness.
- Double click on any gridline. Blue dots will indicate that the gridlines are selected. After that, change the line style, width, and color in the Fill & Line tab.
Add Transparency: If you want to reduce the visibility of the gridlines, set the transparency level between 50% and 70%.

Adjust the Data Marker in the Line Graph
Excel employs the default Circle marker type. However, you can select a different marker option if this one doesn’t go well with the layout of your graph:
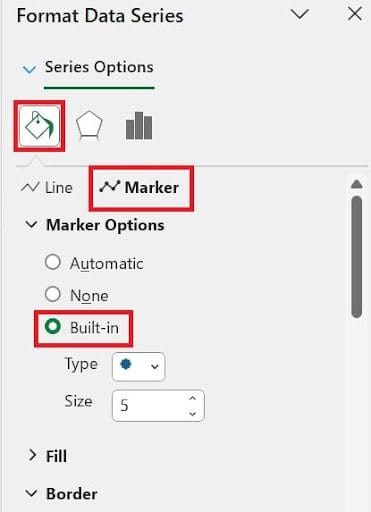
- Double-click on the line in your graph to select the line. Format Data Series pane on the right side of the Excel window will emerge. You can also right-click on the data series and select “Format Data Series.”
- Go to the “Fill & Line” tab on the Format Data Series pane, click “Marker,” select the “Built-in” radio button, expand Marker Options, and type the marker type you want in the Type box.
- You can use the Size box to adjust the markers’ size.

Show and Hide Lines in the Chart
While creating a graph with multiple lines, you might not want to show them all simultaneously. Therefore, you can hide or remove the unnecessary lines using one of the following techniques:
- Hide Columns: To hide a column in your worksheet that you do not want to be plotted in the graph, right-click on it and select Hide. The corresponding line will immediately vanish from the graph. The line will return after you unhide the column.
- Hide Lines in the Chart: Click the Chart Filters button on the graph’s right side, uncheck the data series you wish to conceal, and then click Apply if you don’t want to alter the source data.

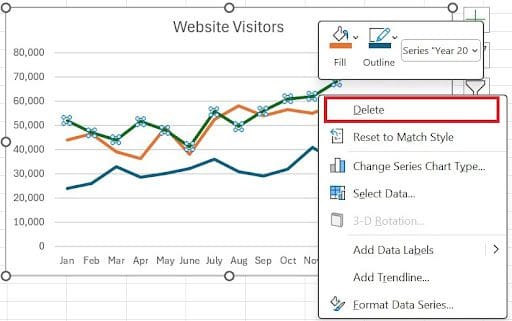
- Delete a Line: Right-click a line in the graph and choose Delete from the context menu to remove it permanently.

Change the Line’s Color and Appearance
If the default line colors do not appeal to you, here’s how to modify them:
- To change the color of a line, double-click on it.
- Navigate to the Fill & Line tab on the Format Data Series pane and select a new line color by clicking on the Color drop box.

- Click More Colors if the default color scheme isn’t enough for your needs. After that, select any RGB color you like.
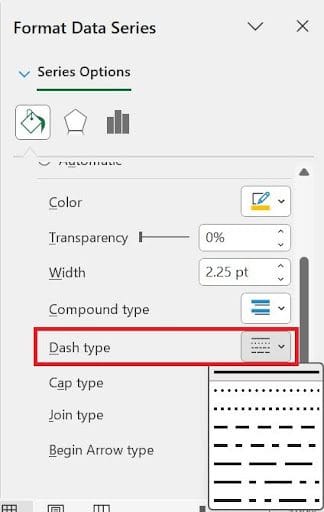
Additionally, you can alter the line type, transparency, dash type, arrow type, and other elements. For instance, click the Dash type drop-down box and select the desired pattern to add a dashed line to your graph.
Smooth Lines and Rounded Corners
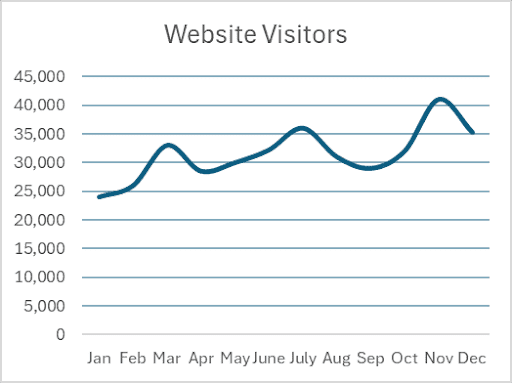
Excel’s built-in line graph feature, which uses angles by default, is often effective. However, if the normal line chart is not sufficiently appealing for your presentation or printed materials, there is a simple approach to smooth the line angles. Here’s what to do:
- To smooth a line, double-click it.
- Select the Smoothed line check box on the Fill & Line tab of the Format Data Series pane.
- To add rounded corners to the chart area, check the “Rounded Corners” box.
If the chart has more than one line, follow the above procedures for each line separately.



Add a Chart Trendline
Including a trendline in your line chart can assist you in seeing the general pattern or direction of your data. It helps with data pattern analysis, trend identification, and prediction. Here’s how you can add a trend line.
- Select the chart by clicking on it.
- To add a trend line, click the “+” icon next to the chart and select “Trendline.” By default, Excel will add a linear trendline.
- Depending on your data and analysis requirements, click the arrow next to “Trendline” and choose a different type (linear, exponential, or moving average).

Formatting the Trendline
- Right-click on the trend line and choose “Format Trendline” from the context menu.
- You may adjust the line thickness, style, and color in the Format Trendline pane.
Wrapping Up!
Line charts are one of the practical ways to visualize data. We hope this guide will help you use MS Excel to make an effective line chart for data visualization.
Are you looking for the best IT providers for your IT projects? Look no further than Hashe! Hashe Computer Solutions is a leading IT solutions provider that offers world-class software, mobile application, web development, and digital marketing services. Contact us for the best web design solutions!
Was this helpful?
Last Modified: January 13, 2025 at 2:12 pm
45 views


